Drone Based Analytics & Thermography with S2E cloud.

Maximize energy yield with IEC-compliant drone thermography. Detect, classify, and pinpoint module defects.

S2E Cloud

AI-driven solar intelligence platform built to inspect, monitor, and optimize performance across utility-scale and rooftop solar.

Thermal IR Inspection of Solar Panels
Infrared Asset Inspection

IEC Compliant Scanning

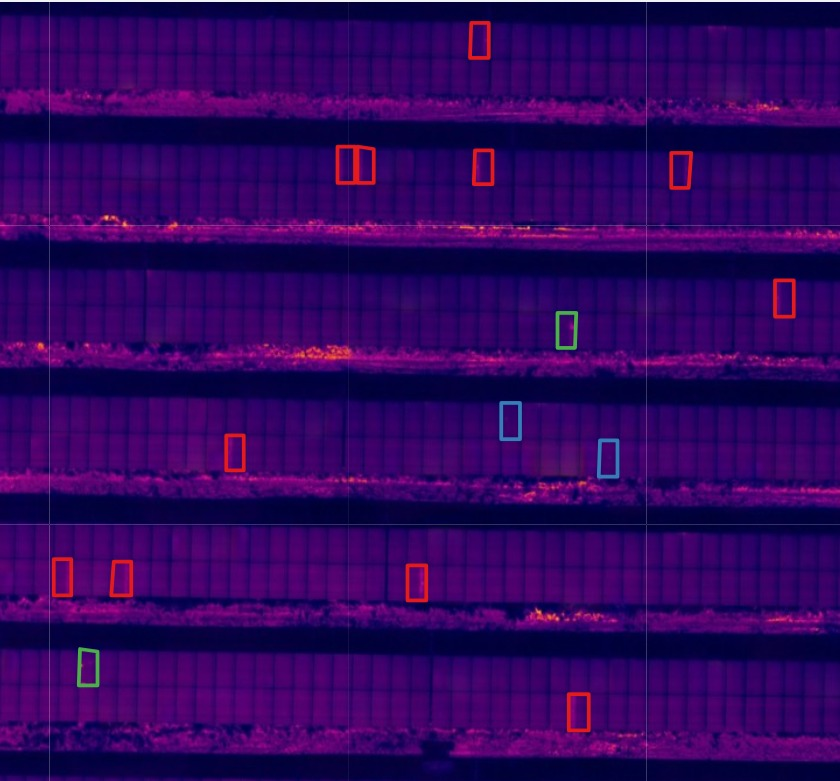
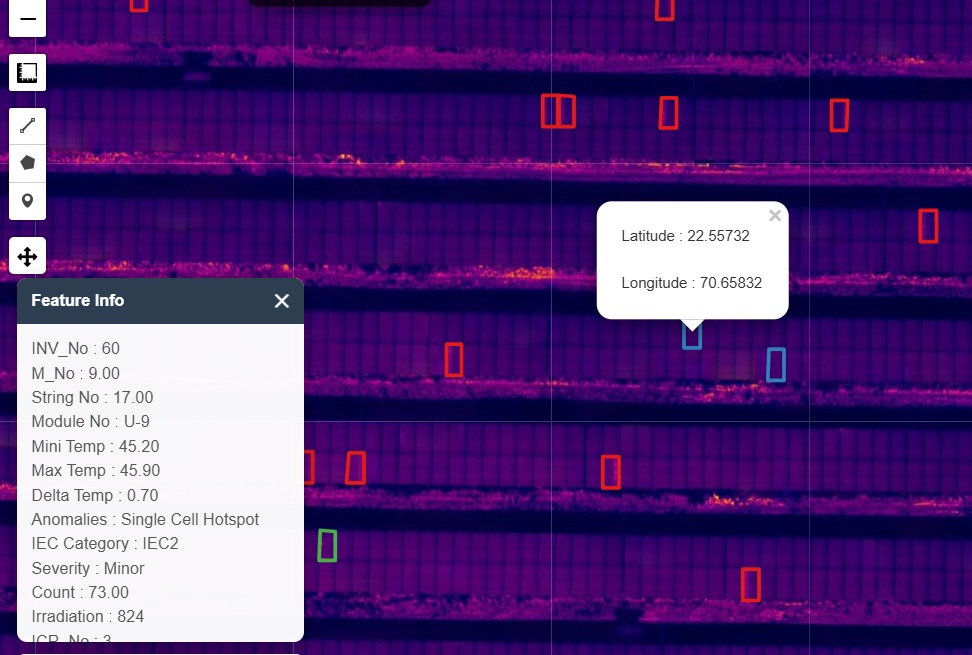
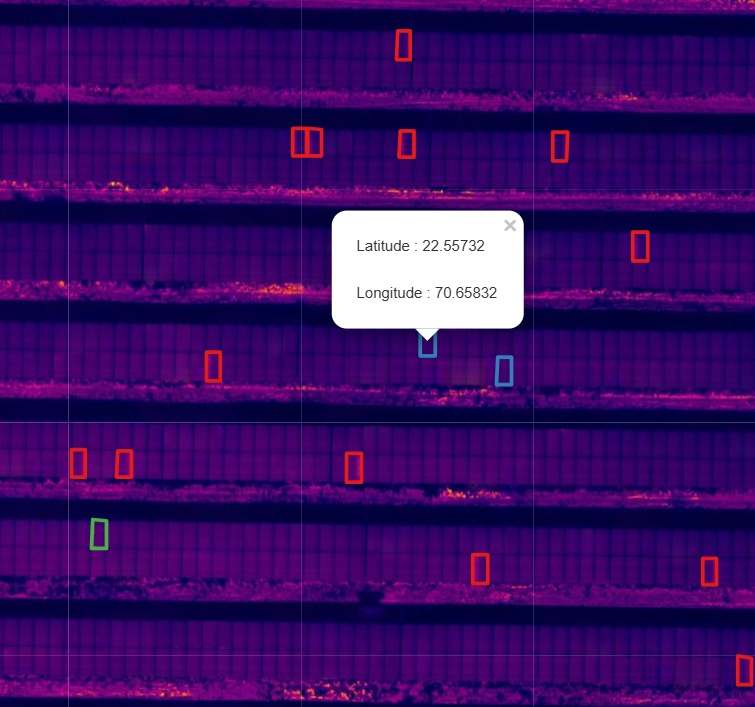
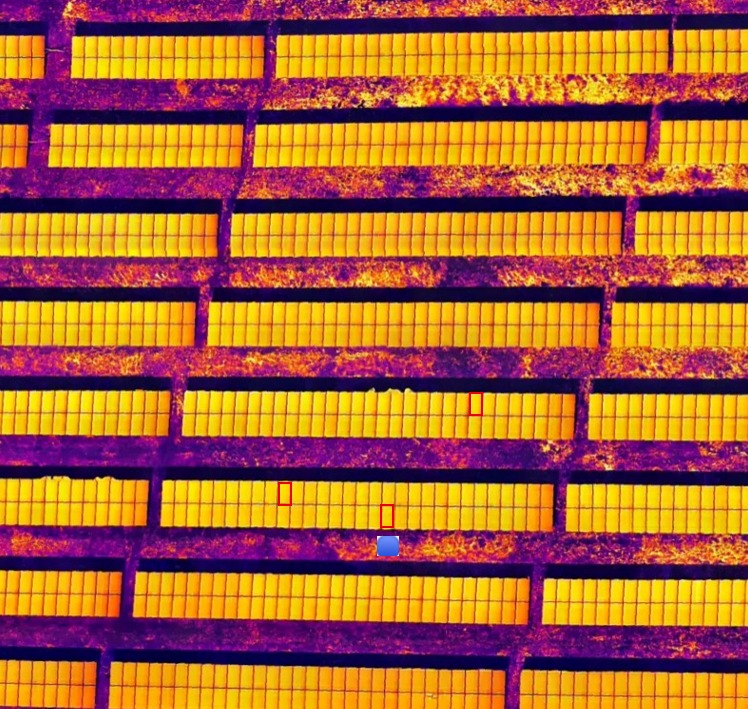
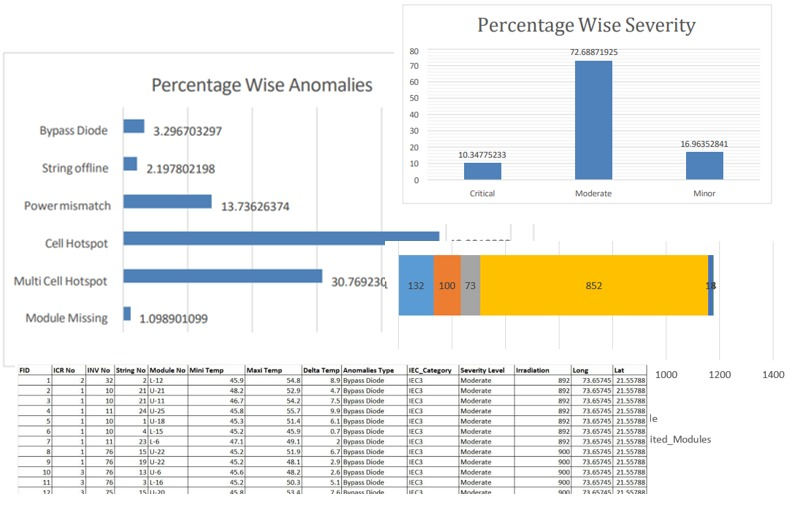
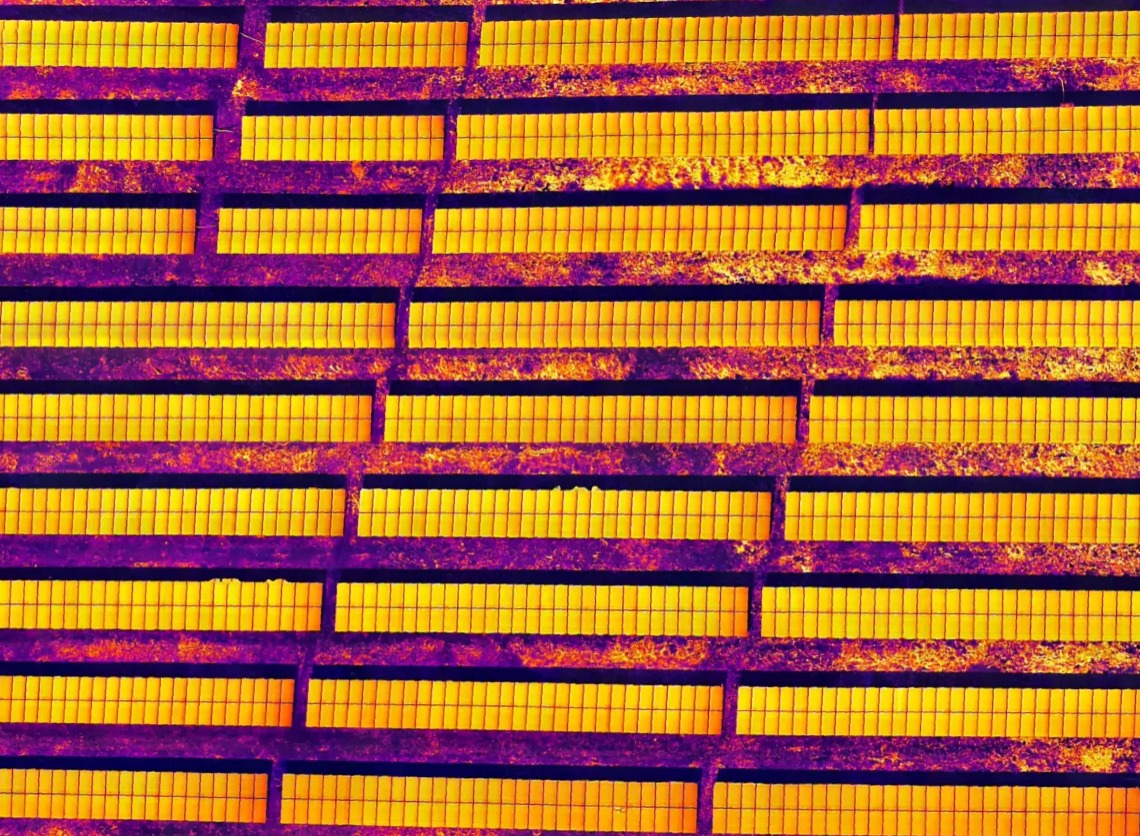
We execute precision radiometric flights strictly following IEC TS 62446-3 standards, ensuring absolute thermal accuracy across your entire utility-scale solar plant.

  • Radiometric Precision Capturing absolute temperature values for every pixel, not just relative heat maps.
  • RGB + IR Fusion Seamlessly overlay thermal anomalies onto high-res visual maps for easy field identification.
  • < 5cm GSD Accurate temperature difference measurements to prioritize critical maintenance.
AI Defect Classification
Anomalies Identification

Comprehensive Defect Classification

Our platform doesn't just find hot spots; it understands them. We automatically categorize thermal anomalies into specific electrical or physical faults.

  • Module Level Identify shattered glass, PID (Potential Induced Degradation), and severe soiling.
  • Cell Level Pinpoint individual hot cells, snail trails, and micro-cracks causing resistance.
  • System Level Detect complete string outages, bypassed diodes, and combiner box failures instantly.
GPS Coordinates Interface Latitude and Longitude Data Location Mapping UI Loop Restart
Digital Twin Integration

Geo-Tagged Fault Location

Stop sending technicians on a scavenger hunt. Every detected defect is mapped to its exact real-world coordinate and logical hierarchy.

  • Exact Pinpoint Location Navigate directly to the faulty Inverter > String > Table > Specific Module.
  • Latitude & Longitude Generate repair tickets formatted specifically for O&M field teams with visual/thermal pairings.
  • User Location Routing Track your live position on-site and automatically align it with detected faults, making it easy to locate issues.
Analytics Overview Report
Data-Driven Insights

Comprehensive Analytics Reports

Transform raw thermal data into structured, easy-to-understand dashboards. Our reports give you a bird's-eye view of plant health while retaining the granular details needed for field repairs.

  • Anomaly Breakdown Visualize your portfolio's health with percentage-wise charts categorizing defects like cell hotspots, bypass diode issues, and power mismatches.
  • Severity Scoring Automatically prioritize your maintenance pipeline with clear visual breakdowns of Critical, Moderate, and Minor severity levels.
  • Granular Field Data Export comprehensive tables containing exact module locations (Lat/Long), string/inverter numbers, and precise Min/Max/Delta temperature readings.

Thermography Deliverables

πŸ“„

Executive Reports

IEC Compliant PDF Report
Executive Summary
Defect Severity Breakdown

πŸ—ΊοΈ

Cloud Portal

High-Res Thermal Orthomosaic
RGB Orthomosaic Overlay
Shapefiles (.SHP) of Defects

πŸ“Š

Raw Data

.CSV Fault Logs
Radiometric JPEGs

Why Choose Sky2Earth Drone Thermography?

01

Maximize Energy Yield

Catch minor thermal anomalies (like PID or micro-cracks) before they cascade into major string failures, ensuring your assets operate at peak capacity.

02

100% Audit Compliance

Guarantee that your inspections meet strict IEC TS 62446-3 standards, providing bulletproof documentation for warranty claims and investor reports.

03

Zero Operational Downtime

Inspect megawatts of capacity in hours while the plant remains fully operational, entirely replacing slow, disruptive manual handheld surveys.

04

Targeted O&M Deployment

Stop guessing. Provide your maintenance teams with exact geo-coordinates and severity classifications to fix only what is actually broken.

Utility Scale Solar Plant Inspection

Ready to transform your data?

From 45MW solar plants to complex mining sites, get the visual intelligence you need.